Are you struggling with performance issues on your Linux server? Understanding how to check and analyze memory usage is crucial for optimizing system performance and ensuring that your applications run smoothly. In this comprehensive guide, we delve into various Linux monitoring tools that empower you to use memory efficiently.
Understanding Linux Memory Management
Before we jump into the commands, it’s important to grasp how Linux manages memory. Linux systems utilize RAM for storing temporary data that are quickly accessible, enhancing the speed and performance of your applications. However, when RAM is full, the system starts using swap space on your hard drive, which is significantly slower. Keeping an eye on your memory usage helps in preventing your system from slowing down.
Checking Memory Usage with free
One of the most straightforward Linux monitoring tools to check memory usage is free. Simply type free -m in your terminal, and you’ll get an output in megabytes, showcasing total, used, and free memory, along with the swap space usage.
For a more human-readable output, you can use free -h. This command adjusts the unit of measurement to provide a clearer picture, making it easier for you to interpret the data.
More details: https://man7.org/linux/man-pages/man1/free.1.html

Delving Deeper with vmstat
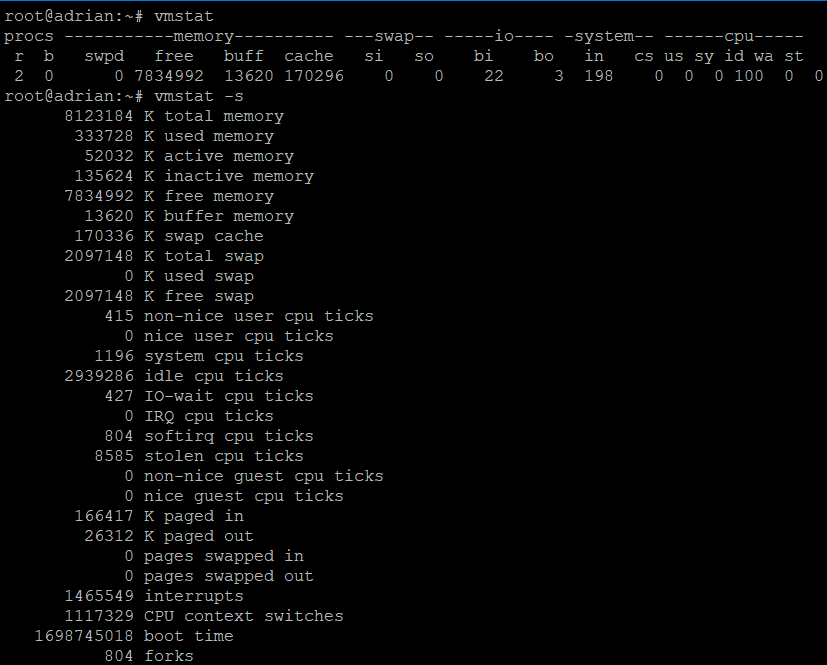
To get more detailed information about your system’s memory, vmstat is an invaluable tool. Execute vmstat -s to view a summary of your memory usage. This command presents an extensive list of parameters and their current values, giving you an in-depth understanding of your system’s performance.
More details: https://man7.org/linux/man-pages/man8/vmstat.8.html

Top: Real-Time Monitoring
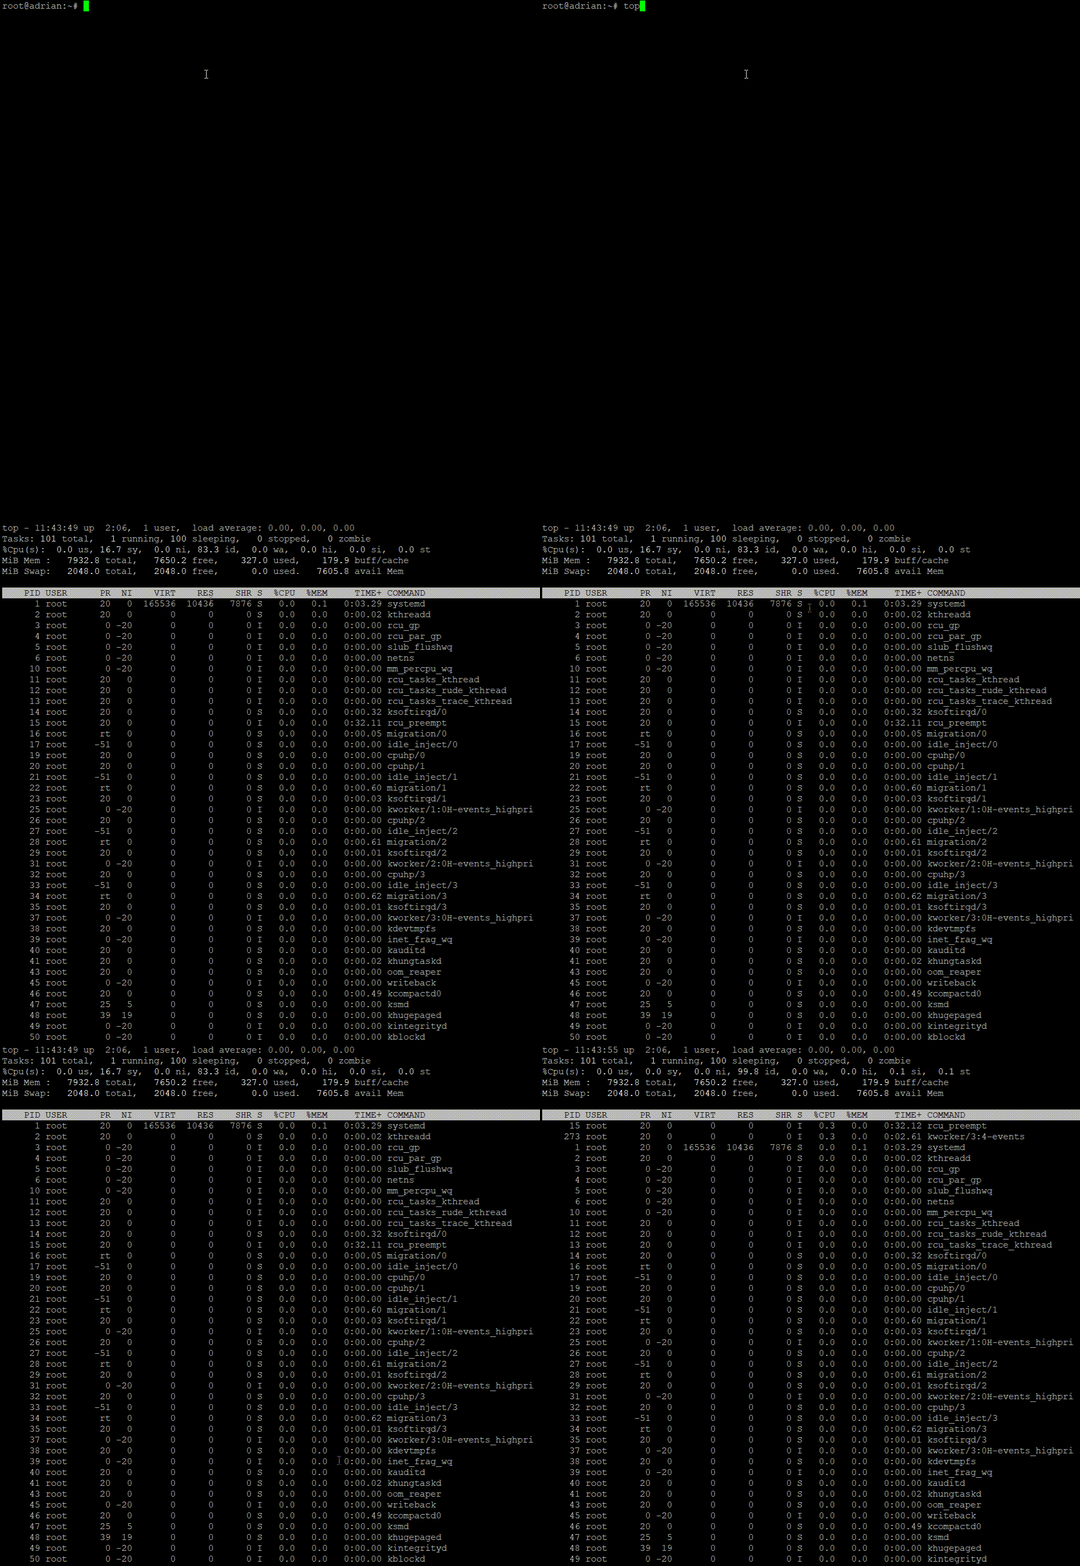
If you prefer real-time monitoring, top is the command for you. Simply type top in your terminal, and you’ll be presented with a live, updated view of your system’s performance, including CPU and memory usage. It’s a dynamic way to monitor which processes are consuming the most resources.
More details: https://man7.org/linux/man-pages/man1/top.1.html

Enhanced Functionality with htop
For an even more user-friendly experience, try htop. This tool provides a colorful, interactive interface for monitoring your system’s performance. If htop is not pre-installed on your Linux distribution, you can easily install it via your package manager.
More details: https://www.man7.org/linux/man-pages/man1/htop.1.html

Diving into Specific Processes with ps
To target specific processes and their memory consumption, ps is the command to use. By executing ps aux, you can view a detailed list of all running processes and their associated memory usage. This command helps you identify any processes that might be hogging memory.
More details: https://man7.org/linux/man-pages/man1/ps.1.html

Conclusion: Keeping Your Linux System Optimized
Regularly monitoring memory usage on your Linux server is key to maintaining optimal performance and ensuring that your applications run seamlessly. By utilizing these Linux Monitoring tools mentioned in this guide, you have the power to keep a close eye on your system’s memory usage and take necessary actions when needed.
Don’t let memory issues slow you down. Equip yourself with these commands and ensure your Linux server runs efficiently at all times. Explore, monitor, and optimize today!
